Page 26 - WEF Reoprt 2020
P. 26

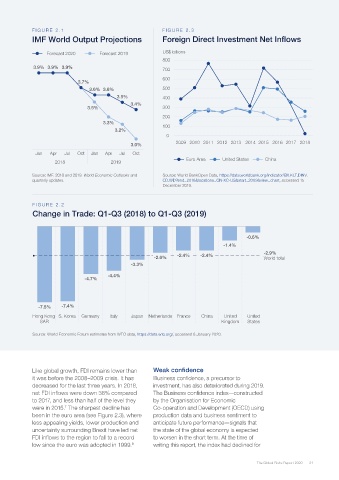
FIG U RE 2 .1                                 FIG U RE 2 .3
            IMF World Output Projections                  Foreign Direct Investment Net Inflows

                  Forecast 2020     Forecast 2019         US$ billions
                                                          800
             3.9% 3.9% 3.9%                               700

                                                          600
                            3.7%
                                3.6% 3.6%                 500
                                          3.5%            400
                                               3.4%
                                3.5%                      300
                                                          200
                                     3.3%                 100
                                         3.2%
                                                           0
                                                               2009 2010 2011 2012 2013 2014 2015 2016 2017 2018
                                               3.0%
             Jan   Apr  Jul  Oct  Jan  Apr  Jul  Oct
                                                                  Euro Area    United States  China
                    2018                2019

            Source: IMF. 2018 and 2019. World Economic  Outlooks and   Source: World BankOpen Data, https://data.worldbank.org/indicator/BX.KLT.DINV.
            quarterly updates.                            CD.WD?end=2018&locations=CN-XC-US&start=2009&view=chart, accessed 15
                                                          December 2019.


            FIG U RE 2 .2
            Change in Trade: Q1-Q3 (2018) to Q1-Q3 (2019)


                                                                                        -0.6%
                                                                               -1.4%
                                                                                              -2.9%
                                                               -2.4%   -2.4%
                                                       -2.6%                                  World total
                                               -3.3%
                                       -4.4%
                               -4.7%


              -7.5%    -7.4%
            Hong Kong  S. Korea  Germany  Italy  Japan  Netherlands  France  China  United  United
               SAR                                                             Kingdom  States

            Source: World Economic Forum estimates from WTO data, https://data.wto.org/, accessed 8 January 2020.


            Like global growth, FDI remains lower than   Weak confidence
            it was before the 2008–2009 crisis. It has   Business confidence, a precursor to
            decreased for the last three years. In 2018,   investment, has also deteriorated during 2019.
            net FDI inflows were down 38% compared     The Business confidence index—constructed
            to 2017, and less than half of the level they   by the Organisation for Economic
            were in 2015.  The sharpest decline has    Co-operation and Development (OECD) using
                        7
            been in the euro area (see Figure 2.3), where   production data and business sentiment to
            less appealing yields, lower production and   anticipate future performance—signals that
            uncertainty surrounding Brexit have led net   the state of the global economy is expected
            FDI inflows to the region to fall to a record   to worsen in the short term. At the time of
            low since the euro was adopted in 1999.    writing this report, the index had declined for
                                               8

                                                                                           The Global Risks Report 2020  21
   21   22   23   24   25   26   27   28   29   30   31